In medical and biological research, understanding how data is distributed is essential for choosing the right statistical methods and making reliable conclusions. Data can follow different types of distributions, with the two main categories being normal distributions and non-normal distributions. Recognizing these patterns helps researchers apply appropriate analysis techniques and avoid misleading results.
What is a Normal Distribution?
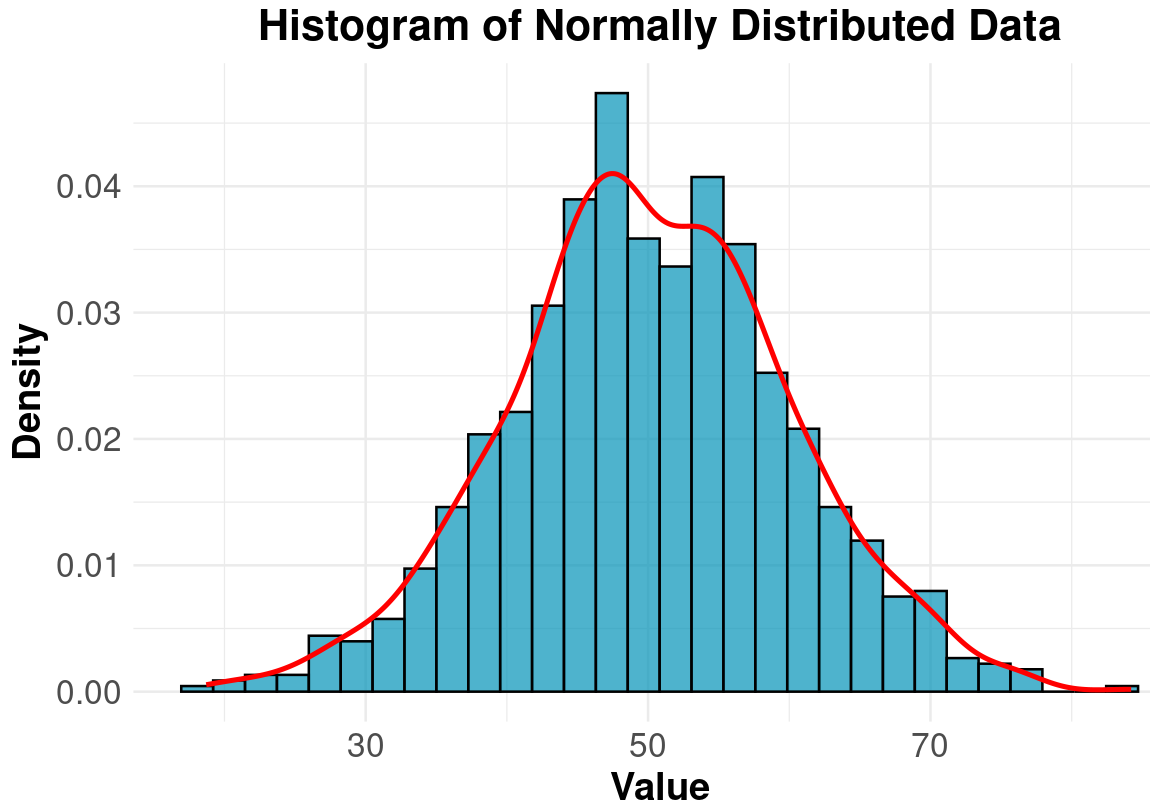
A normal distribution is a symmetric, bell-shaped pattern where most values cluster around a central point, with fewer extreme values on either side. This type of distribution is common in biological and medical data, making it a key assumption for many statistical tests.
Examples of Normal Distributions in Medicine and Biology
- Human height and weight tend to follow a normal distribution, with most people falling near the average and fewer individuals being extremely short or tall.
- Blood pressure readings in a healthy population often form a normal distribution, where most individuals have values close to the mean and very high or very low readings are rare.
- Reaction times in cognitive tests typically follow a normal pattern, where most people respond within a common time range.
Why is Normal Distribution Important?
Many statistical tests, such as t-tests and ANOVA, assume normality because they rely on predictable variability in the data. When data follows a normal distribution, researchers can make inferences about an entire population based on sample data.
What is a Non-Normal Distribution?
A non-normal distribution occurs when data does not fit the symmetrical bell-shaped curve of a normal distribution. These distributions can be skewed, have multiple peaks, or show extreme values (outliers).
Types of Non-Normal Distributions
- Skewed Distribution: When data is not symmetrical. If a dataset has a long tail on the right, it is positively skewed (e.g., income levels in a population). If the tail is on the left, it is negatively skewed (e.g., age at death in a population, where most people live long lives, but a few die young).
- Bimodal Distribution: When data has two peaks instead of one. This might indicate that two different populations are being studied together (e.g., male and female hemoglobin levels).
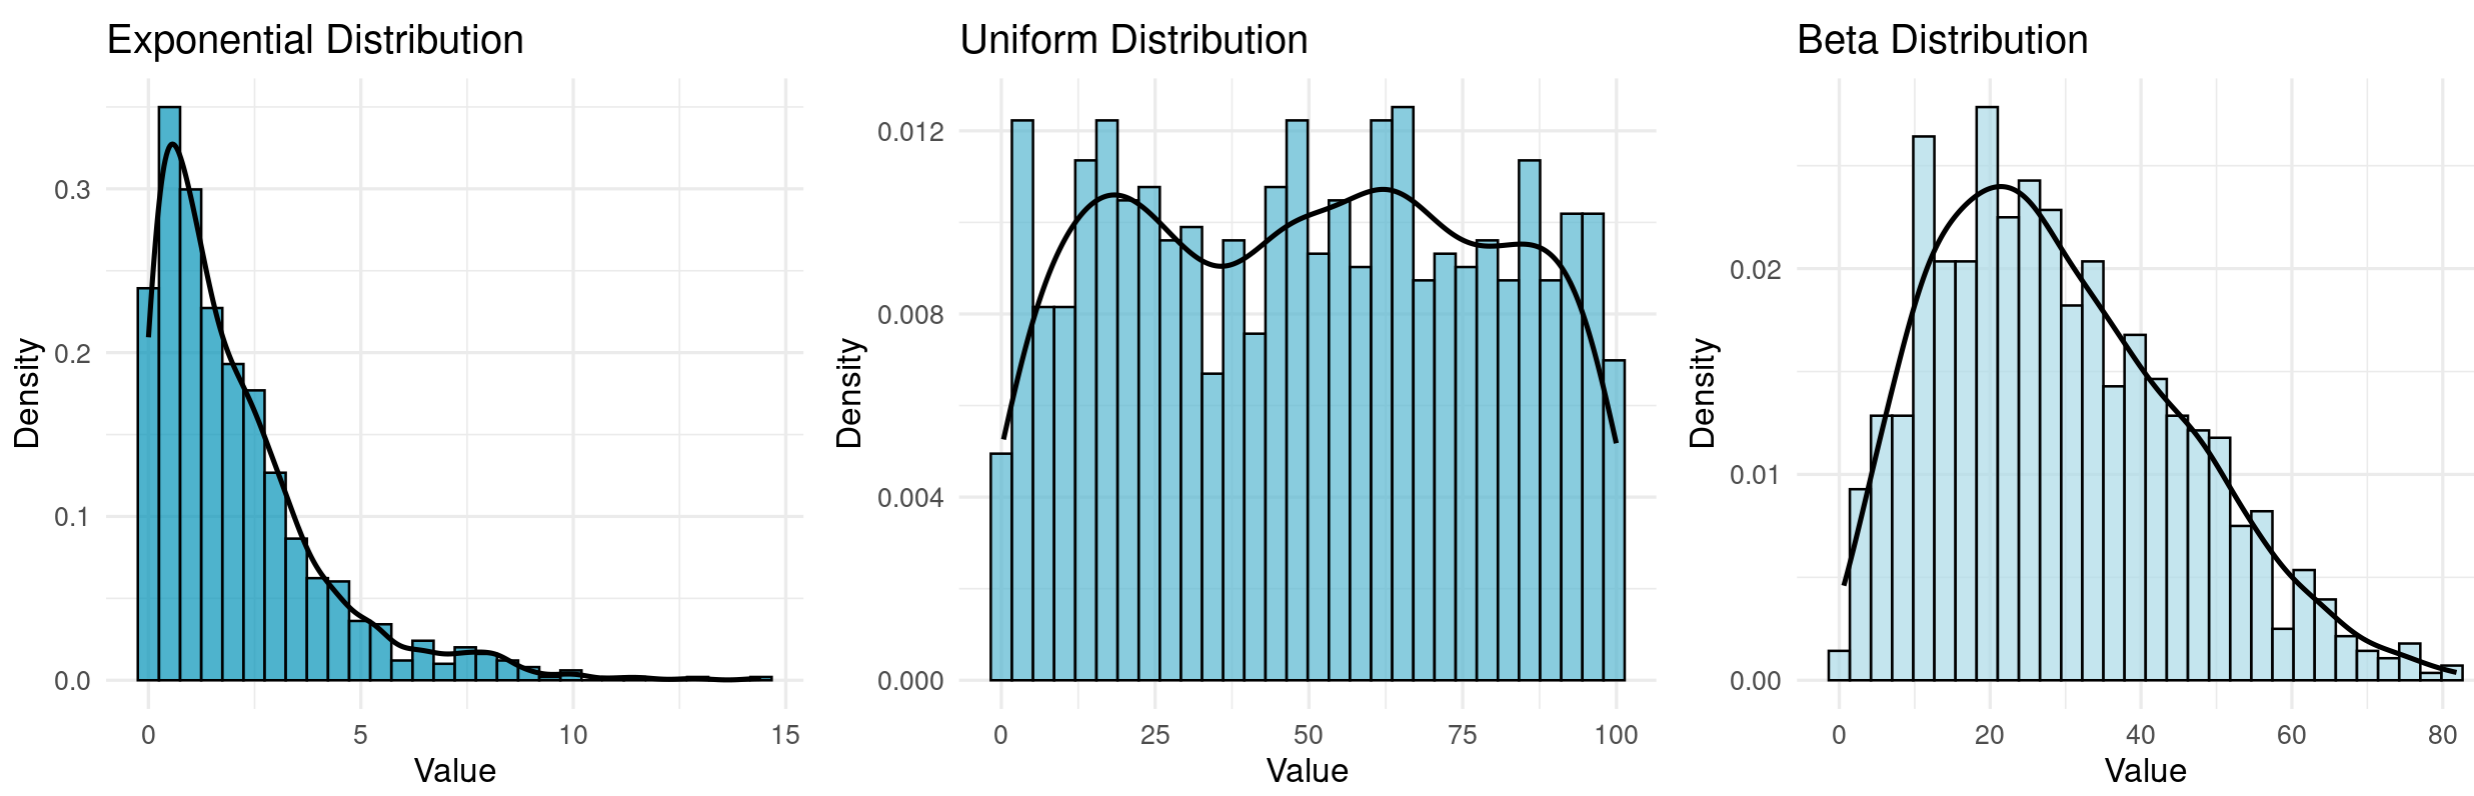
- Uniform Distribution: When all values occur with roughly the same frequency, meaning there is no single central peak (e.g., random errors in a laboratory experiment).
- Exponential Distribution: When small values are more common, and large values are rare (e.g., time until the next heart attack in a patient with cardiovascular disease).
Examples of Non-Normal Distributions in Medicine and Biology
- Length of hospital stays is often skewed because most patients are discharged within a few days, but a few have much longer stays.
- Viral load in infected patients tends to follow an exponential distribution, where most people have low viral loads, but a few have extremely high values.
- Tumor sizes can be skewed because many patients have small tumors, while only a few have very large ones.
How to Handle Non-Normal Distributions
When data is non-normal, standard statistical methods may not be appropriate. Researchers can use the following strategies:
- Transformation: Applying mathematical functions (e.g., log transformation) can help normalize skewed data.
- Non-Parametric Tests: Tests such as the Mann-Whitney U test and Kruskal-Wallis test do not assume normality and are useful when data is skewed or has outliers.
- Larger Sample Size: As sample sizes increase, many distributions tend to approximate normality due to the Central Limit Theorem, allowing normal-based methods to be used.
Importantly, at Nezu Biotech GmbH, we offer Data analysis services to life science institutions – both from academia and industry. The goal is clear: we take care of the data analysis, ensuring correctness and speed, so your team can focus on other important tasks.
Conclusion
Understanding whether data follows a normal or non-normal distribution is crucial for selecting appropriate statistical analyses in medical and biological research. Normal distributions allow for traditional parametric tests, while non-normal distributions require alternative approaches such as transformations or non-parametric tests. By recognizing and addressing distributional patterns, researchers can ensure their findings are valid and reliable.
Disclaimer: The information provided in this learning center is for educational and informational purposes only and should not be considered as medical, legal, or professional advice. While we strive to ensure accuracy, we do not guarantee that all content is up to date or free from errors. This material is not intended to diagnose, treat, cure, or prevent any disease, nor should it replace professional medical advice, consultation, or care. Users are encouraged to consult with qualified professionals before making any decisions based on the information provided. The company assumes no responsibility for any consequences resulting from the use or misuse of this content, and by accessing this information, users agree that the company is not liable for any direct or indirect damages arising from reliance on the material presented here.